
Molecule Visualizer MCP Server
About
MCP server for visualizing molecules in Claude Desktop :)
Details
- Author
- leelasd
- GitHub stars
- 2
- Downloads
- 271
- Categories
- Other
Jump to
- Generate 2D visualizations from SMILES strings or common names.
- Return MCP Image objects for direct LLM integration.
- Markdown‑compatible output with base64‑encoded images.
- Customizable image dimensions and optional atom indices.
- Calculate molecular properties including Lipinski’s Rule of Five.
- Access a built‑in database of common molecules by name.

Setting up with Highlight
This MCP is not yet compatible with Highlight’s one-click setup. However, you can still use it with Highlight by following these steps:
- Download and install Highlight from highlightai.com/download
- Navigate to the plugins tab and select "Add Custom Plugin"
-
Configure the plugin with the settings below
Plugin Name
Molecule Visualizer MCP ServerCommand (node, npx, python, etc.)Please refer to the README for specific instructions on how to obtain API keys or other required environment variables.
- Enable "Start Automatically" if you want the plugin to start when Highlight launches





From the repository
Install Python 3.10+, RDKit, the MCP Python SDK, and Pillow. Run the setup script or use uv to install dependencies, then configure Claude Desktop by adding the server to claude_desktop_config.json. You can also run the server directly with python molecule_server.py.
Claude Desktop / Cursor
Paste into your MCP client config file to install this server.
{
    "mcpServers": {
        "molecule visualizer mcp server": {
            "molecule_mcp": {
                "command": "uv",
                "args": [
                    "venv"
                ]
            }
        }
    }
}McpServers
{
    "molecule_mcp": {
        "command": "uv",
        "args": [
            "venv"
        ]
    }
}
Molecule Visualizer MCP Server
<div align="center">




</div>
A Model Context Protocol (MCP) server that provides tools for visualizing molecules and retrieving molecular properties using SMILES codes. This server integrates with LLM applications like Claude Desktop to provide chemistry-focused capabilities.
Table of Contents
- Overview
- Features
- Installation
- Usage
- Running the Server
- With Claude Desktop
- Test Client
- API Reference
- Tools
- Resources
- Common Molecules
- Examples
- Requirements
- License
- Contributing
Overview
The Molecule Visualizer MCP server provides LLM applications with the ability to:
1. Generate 2D visualizations of molecules from SMILES strings
2. Calculate and display molecular properties
3. Access a database of common molecules by name
This enables chemistry-related use cases such as exploring molecular structures, analyzing chemical properties, and generating molecule visualizations for educational content or research assistance.
Screenshots
Using the MCP Server with Claude
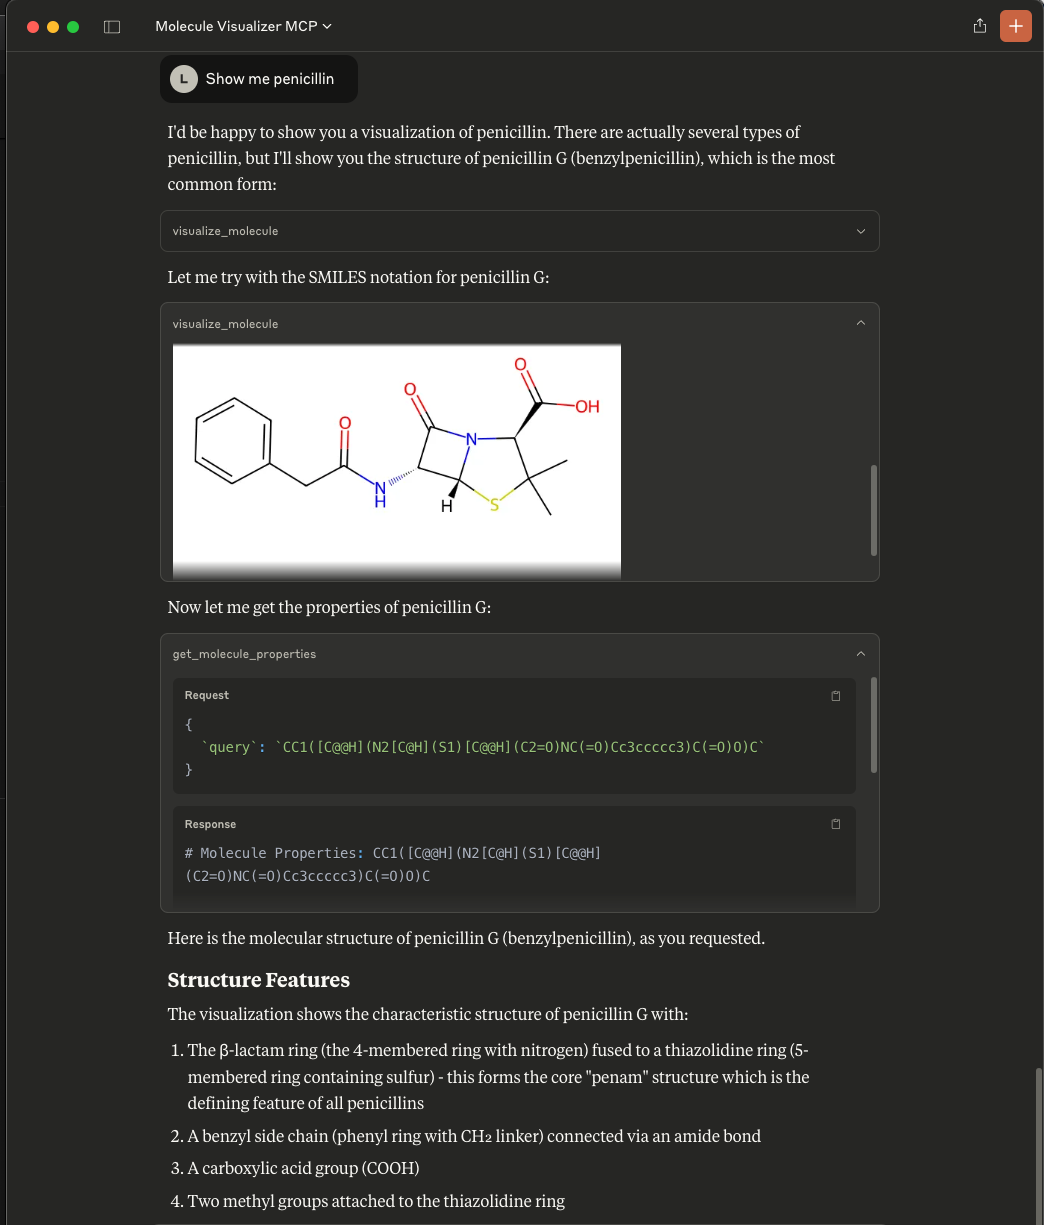
Claude using the Molecule Visualizer MCP server to display molecular structures.
Visualizing Molecules using SMILES
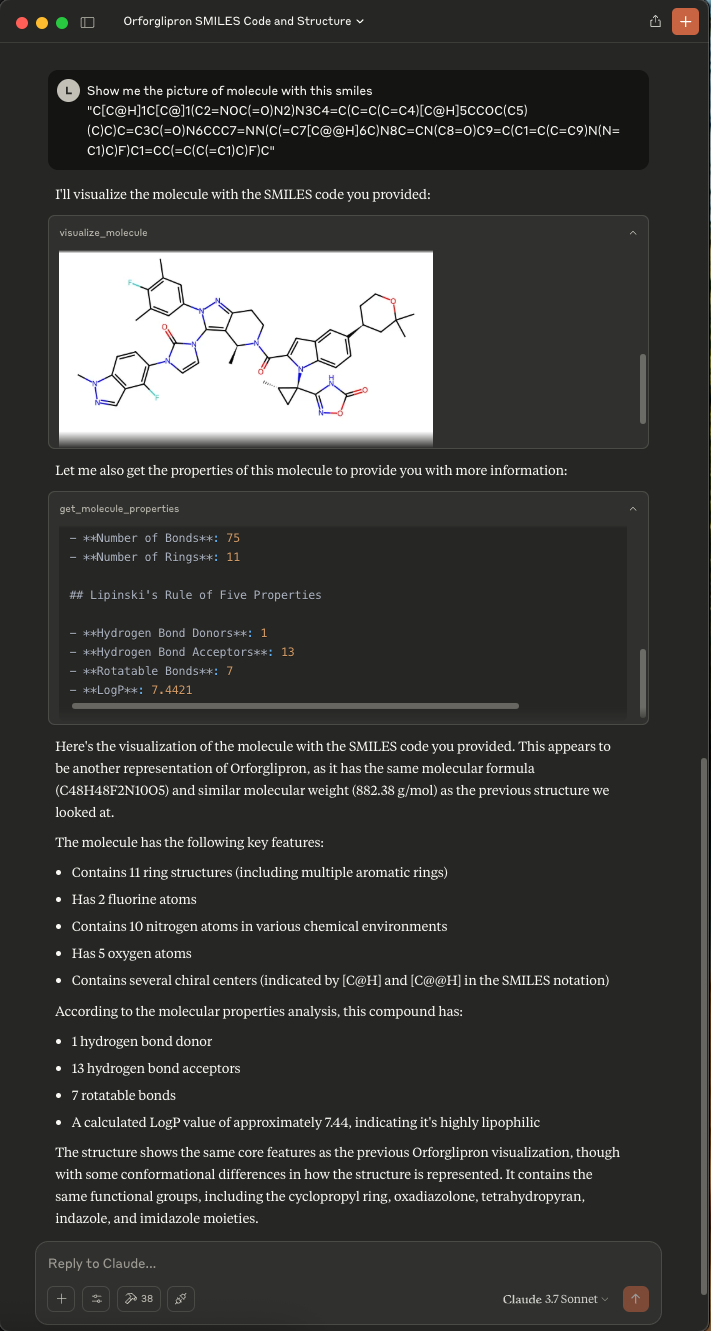
Providing direct SMILES codes to generate molecular visualizations.
Comparison with Web Access
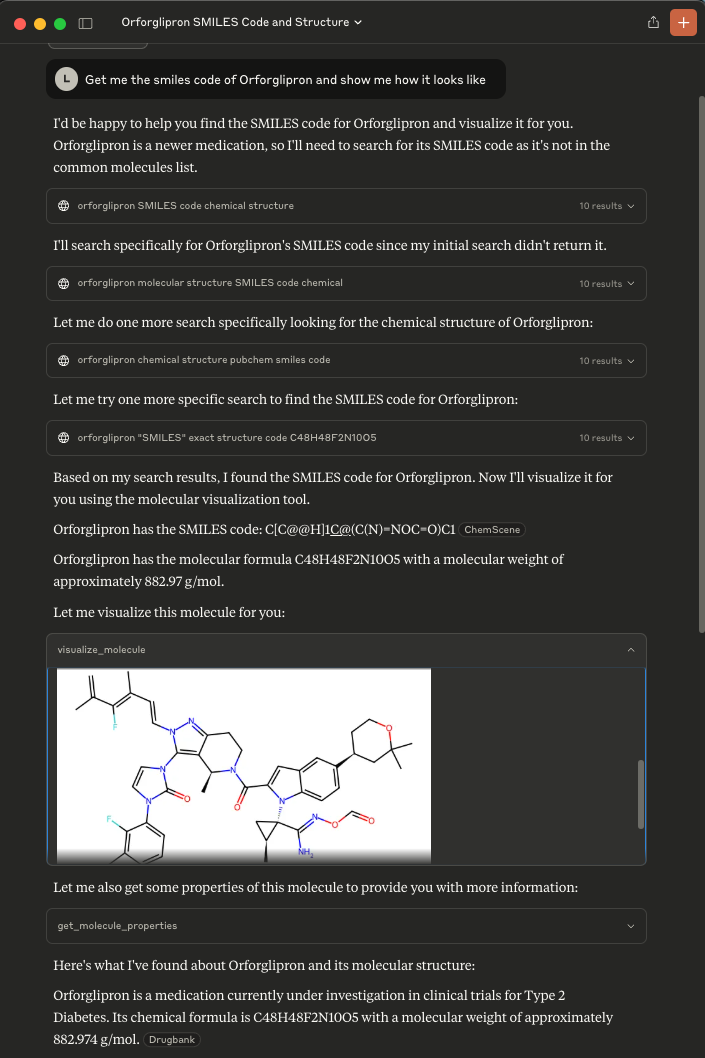
Attempting similar visualization with web access did not work as Claude fails at getting the right smiles code from the internet. - MCP provides more reliable chemistry capabilities if pubchempy and chembl client are added to this.
Features
Molecule Visualization
- Generate 2D visualizations of molecules from SMILES strings or common names
- Returns proper MCP Image objects for direct integration with LLM applications
- Option for markdown-compatible version with base64-encoded images
- Customizable image dimensions and display options
- Option to show atom indices for educational purposes
Molecular Properties
- Basic properties:
- Molecular formula
- Molecular weight
- Atom and bond counts
- Ring count
- Lipinski's Rule of Five properties:
- Hydrogen bond donors
- Hydrogen bond acceptors
- Rotatable bonds
- LogP (lipophilicity)
Installation
Prerequisites
- Python 3.10 or higher
- RDKit (cheminformatics library)
- MCP Python SDK
- PIL (Python Imaging Library)
Step-by-step Installation
1. Clone this repository:
   git clone https://github.com/yourusername/molecule-visualizer.git

   cd molecule-visualizer
2. Run the setup script which creates a virtual environment and installs dependencies:
   chmod +x setup.sh

   ./setup.sh
3. Activate the virtual environment:
source venv/bin/activate
Alternative Installation using uv
You can also use the fast uv package manager (recommended in the MCP documentation):
1. Install uv if you don't already have it:
pip install uv
2. Create a virtual environment:
uv venv
3. Install dependencies:
uv pip install -r requirements.txt
Or install dependencies directly:
   uv add "mcp[cli]"

   uv add "rdkit>=2023.3.1"

   uv add "pillow>=10.0.0"
4. Activate the virtual environment:
source .venv/bin/activate
Usage
Running the Server
To run the server directly:
python molecule_server.py
The server will start and listen for MCP connections.
With Claude Desktop
1. Install Claude Desktop
2. Edit your Claude Desktop configuration file:
- macOS: ~/Library/Application Support/Claude/claude_desktop_config.json
- Windows: %APPDATA%\Claude\claude_desktop_config.json
3. Add the Molecule Visualizer server configuration:
{
  "mcpServers": {
    "Molecule Visualizer": {
      "command": "uv",
      "args": [
        "run",
        "--with",
        "mcp[cli]",
        "--with",
        "pillow",
        "--with",
        "rdkit",
        "mcp",
        "run",
        "/ABSOLUTE-PATH-TO-MOLECULE-SERVER/molecule_server.py"
      ]
    }
  }
}
4. Restart Claude Desktop
5. In Claude, you can now use molecule visualization:
Please show me a visualization of aspirin
Test Client
A test client is included to demonstrate how to use the server:
python test_client.py
This will connect to the server and run through several examples of using the tools and resources.
API Reference
Tools
visualize_molecule
Generate a 2D visualization of a molecule as an Image object.
Parameters:
- query (string): Molecule name or SMILES string
- width (integer, optional): Width in pixels (default: 400)
- height (integer, optional): Height in pixels (default: 300)
- show_atom_indices (boolean, optional): Whether to show atom indices (default: false)
Returns:
- Image object containing the molecule visualization (PNG format)
visualize_molecule_markdown
Generate a 2D visualization of a molecule as a markdown string with embedded base64-encoded image.
Parameters:
- Same as visualize_molecule
Returns:
- Markdown string with embedded base64-encoded PNG image
get_molecule_properties
Get properties of a molecule.
Parameters:
- query (string): Molecule name or SMILES string
Returns:
- Markdown formatted text with molecular properties
get_common_molecules
Get a list of common molecules that can be visualized.
Parameters:
- None
Returns:
- Markdown formatted list of common molecule names
Resources
molecule://{name}/smiles
Get the SMILES string for a common molecule.
Parameters:
- name (string): Name of the common molecule
Returns:
- SMILES string for the molecule
molecules://common
List all common molecules available in the database.
Returns:
- JSON formatted list of molecule names and their SMILES strings
Examples
Visualizing a Molecule
from mcp import ClientSession, StdioServerParameters
from mcp.client.stdio import stdio_client
async def visualize():

    server_params = StdioServerParameters(

        command="python",

        args=["path/to/molecule_server.py"],

        env=None

    )


    async with stdio_client(server_params) as (stdin, stdout):

        client = ClientSession(stdin, stdout)

        await client.initialize()


        # Visualize aspirin

        result = await client.call_tool("visualize_molecule", {"query": "aspirin"})


        # The image data is in result.content[0].image.data

        # The image format is in result.content[0].image.format


        # Save the image to a file

        with open("aspirin.png", "wb") as f:

            f.write(result.content[0].image.data)
Getting Molecule Properties
```python
Sign in to leave a review
Use Google, GitHub, or an email account so ratings stay tied to real people.
No reviews posted yet.





