Prometheus
About
Bridges Prometheus metrics data to enable easy retrieval and analysis of monitoring information for automated system health checks, performance tracking, and anomaly detection.
Details
- Author
- loglmhq
- Repository
- loglmhq/mcp-server-prometheus
- GitHub stars
- 16
- Downloads
- 237
- License
- MIT License
- Categories
- Productivity, Developer Tools, Design, Workplace, AI, Search, Infrastructure, Communication, Automation
- Tags
- #analytics
Jump to
- List all available Prometheus metrics with descriptions
- Read detailed metric information including:
- Metadata and help text
- Current statistical data (count, min, max values)
- Basic authentication support for secured Prometheus instances

Setting up with Highlight
This MCP is not yet compatible with Highlight’s one-click setup. However, you can still use it with Highlight by following these steps:
- Download and install Highlight from highlightai.com/download
- Navigate to the plugins tab and select "Add Custom Plugin"
-
Configure the plugin with the settings below
Plugin Name
PrometheusCommand (node, npx, python, etc.)/path/to/mcp-server-prometheus/build/index.jsEnvironment-
PROMETHEUS_URL
http://your-prometheus-instance:9090
Please refer to the README for specific instructions on how to obtain API keys or other required environment variables.
-
PROMETHEUS_URL
- Enable "Start Automatically" if you want the plugin to start when Highlight launches





From the repository
To use with Claude Desktop, add the server config:
On MacOS: ~/Library/Application Support/Claude/claude_desktop_config.json
On Windows: %APPDATA%/Claude/claude_desktop_config.json
{
"mcpServers": {
"mcp-server-prometheus": {
"command": "/path/to/mcp-server-prometheus/build/index.js",
"env": {
"PROMETHEUS_URL": "http://your-prometheus-instance:9090"
}
}
}
}
Claude Desktop / Cursor
Paste into your MCP client config file to install this server.
{
    "mcpServers": {
        "prometheus": {
            "env": {
                "PROMETHEUS_URL": "http://your-prometheus-instance:9090"
            },
            "args": [],
            "command": "/path/to/mcp-server-prometheus/build/index.js"
        }
    }
}Linux
{
"env": {
"PROMETHEUS_URL": "http://your-prometheus-instance:9090"
},
"args": [],
"command": "/path/to/mcp-server-prometheus/build/index.js"
}Macos
{
"env": {
"PROMETHEUS_URL": "http://your-prometheus-instance:9090"
},
"args": [],
"command": "/path/to/mcp-server-prometheus/build/index.js"
}Windows
{
"env": {
"PROMETHEUS_URL": "http://your-prometheus-instance:9090"
},
"args": [],
"command": "/path/to/mcp-server-prometheus/build/index.js"
}mcp-server-prometheus
MCP server for interacting with Prometheus metrics and data.
This is a TypeScript-based MCP server that implements a Prometheus API interface. It provides a bridge between Claude and your Prometheus server through the Model Context Protocol (MCP).
<a href="https://glama.ai/mcp/servers/y7b3qba8jy"></a>
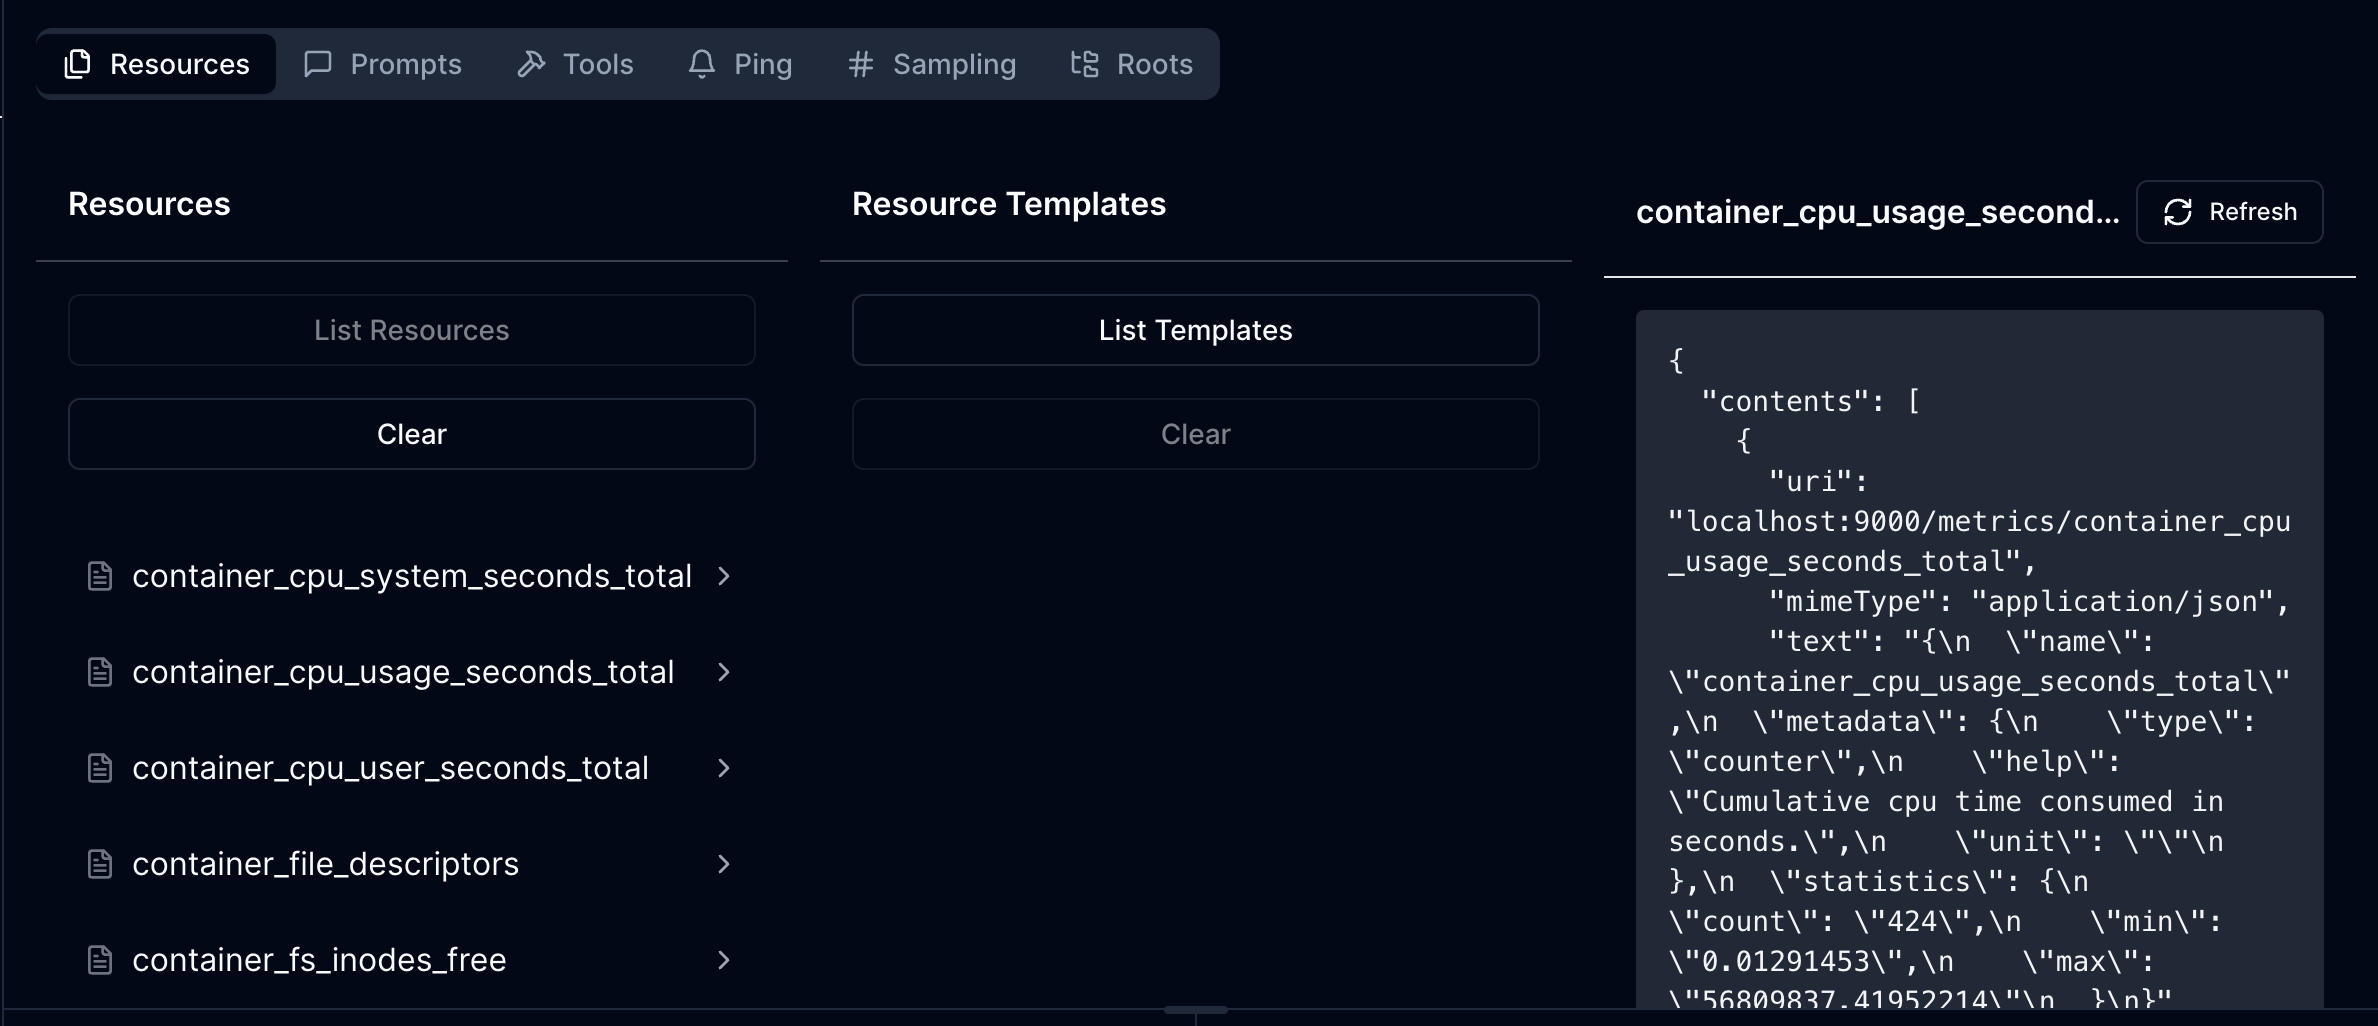
Demo
Features
Resources
- List and access Prometheus metric schema
- Each metric resource provides:
- Metric name and description
- Detailed metadata from Prometheus
- Statistical information (count, min, max)
- JSON mime type for structured data access
Current Capabilities
- List all available Prometheus metrics with descriptions
- Read detailed metric information including:
- Metadata and help text
- Current statistical data (count, min, max values)
- Basic authentication support for secured Prometheus instances
Configuration
The server requires the following environment variable:
- PROMETHEUS_URL: The base URL of your Prometheus instance
Optional authentication configuration:
- PROMETHEUS_USERNAME: Username for basic auth (if required)
- PROMETHEUS_PASSWORD: Password for basic auth (if required)
Development
Install dependencies:
npm install
Build the server:
npm run build
For development with auto-rebuild:
npm run watch
Installation
To use with Claude Desktop, add the server config:
On MacOS: ~/Library/Application Support/Claude/claude_desktop_config.json
On Windows: %APPDATA%/Claude/claude_desktop_config.json
{
  "mcpServers": {
    "mcp-server-prometheus": {
      "command": "/path/to/mcp-server-prometheus/build/index.js",
      "env": {
        "PROMETHEUS_URL": "http://your-prometheus-instance:9090"
      }
    }
  }
}
Debugging
Since MCP servers communicate over stdio, debugging can be challenging. We recommend using the MCP Inspector:
npm run inspector
The Inspector will provide a URL to access debugging tools in your browser.
API Structure
The server exposes Prometheus metrics through the following URI structure:
- Base URI: http://your-prometheus-instance:9090
- Metric URIs: http://your-prometheus-instance:9090/metrics/{metric_name}
Each metric resource returns JSON data containing:
- Metric name
- Metadata (help text, type)
- Current statistics (count, min, max)
Sign in to leave a review
Use Google, GitHub, or an email account so ratings stay tied to real people.
No reviews posted yet.