
Chart
About
This server offers a wide variety of chart types with comprehensive Zod schema validation for type-safe chart configuration.
Details
- Author
- KamranBiglari
- Downloads
- 304
- Categories
- Other
Jump to
- Over 15 chart types including financial and statistical visualizations
- Full Zod schema validation for all chart configurations
- Multiple deployment options: local server, HTTP streaming, and SSE
- Ready-to-use endpoints for Claude.AI integration
- Professional chart support for financial, statistical, and business data

Setting up with Highlight
This MCP is not yet compatible with Highlight’s one-click setup. However, you can still use it with Highlight by following these steps:
- Download and install Highlight from highlightai.com/download
- Navigate to the plugins tab and select "Add Custom Plugin"
-
Configure the plugin with the settings below
Plugin Name
ChartCommand (node, npx, python, etc.)Please refer to the README for specific instructions on how to obtain API keys or other required environment variables.
- Enable "Start Automatically" if you want the plugin to start when Highlight launches





From the repository
For local development, clone the repository, install dependencies with npm install, build with npm run build, and start with npm start. For immediate use with Claude.AI without local setup, add the public Streamable HTTP endpoint (https://chart.mcp.cloudcertainty.com/mcp) or Server-Sent Events endpoint (https://chart.mcp.cloudcertainty.com/sse) to your MCP client configuration.
GetChartImgLink
To draw chart and get chart image link by parameters, and parameter grammar follows Quick Chart API (quickchart.io).
Claude Desktop / Cursor
Paste into your MCP client config file to install this server.
{
    "mcpServers": {
        "chart": {
            "chart-server": {
                "command": "node",
                "args": [
                    "path/to/mcp-server-chart/dist/index.js"
                ]
            }
        }
    }
}McpServers
{
    "chart-server": {
        "command": "node",
        "args": [
            "path/to/mcp-server-chart/dist/index.js"
        ]
    }
}
MCP Chart Server
A Model Context Protocol (MCP) server that provides comprehensive chart generation capabilities. This server offers a wide variety of chart types with comprehensive Zod schema validation for type-safe chart configuration.
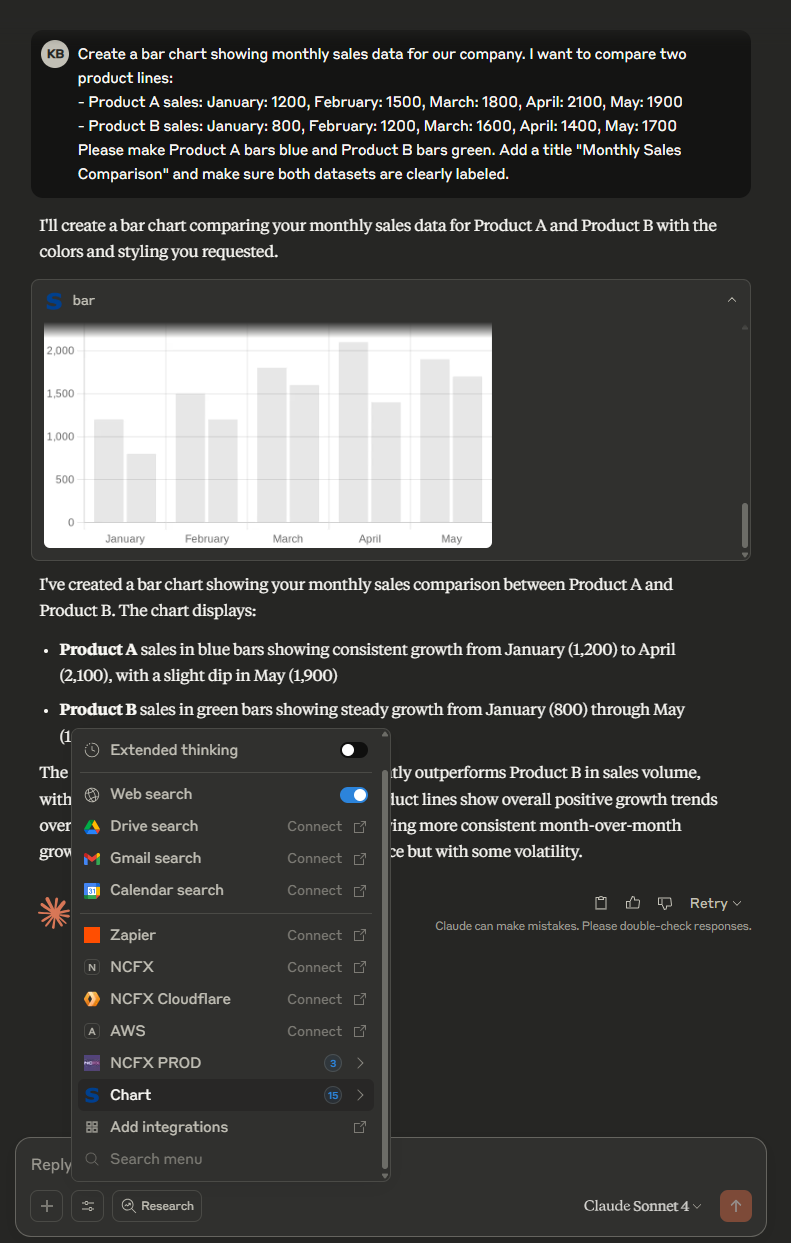
Claude.AI Integration (Free Running Version)
For immediate use with Claude.AI without local setup, use these public endpoints:
- Streamable HTTP: https://chart.mcp.cloudcertainty.com/mcp
- Server-Sent Events: https://chart.mcp.cloudcertainty.com/sse
Simply add either endpoint to your Claude.AI MCP configuration to start generating charts immediately.
Features
- 🎯 15+ Chart Types - Comprehensive chart library covering all major visualization needs
- 🔒 Type Safety - Full Zod schema validation for all chart configurations
- 🌐 Multiple Deployment Options - Local server, HTTP streaming, and SSE endpoints
- 🚀 Claude.AI Integration - Ready-to-use endpoints for Claude.AI integration
- 📊 Professional Charts - Support for financial, statistical, and business visualizations
Chart Types Supported
Basic Charts
- Bar Chart - Traditional bar charts with multiple datasets - Line Chart - Line charts with customizable styling and fill options - Pie Chart - Pie charts with hover effects and custom colors - Radar Chart - Multi-axis radar charts for comparative analysis - Polar Area Chart - Radial area charts for cyclical dataAdvanced Charts
- Doughnut Chart - Enhanced pie charts with center labels and semi-circle support - Scatter Plot - X/Y coordinate plotting with optional trend lines - Bubble Chart - Three-dimensional data visualization with bubble sizes - OHLC Chart - Financial candlestick charts with volume and indicatorsSpecialized Charts
- Violin Plot - Statistical distribution visualization - Gauge Chart - Customizable gauge meters with thresholds - Radial Gauge - Simple radial progress indicators - Progress Bar - Linear progress indicators - Sparkline - Minimal trend visualization - Sankey Diagram - Flow and process visualizationQuick Start
Local Development
1. Clone the repository
   git clone https://github.com/KamranBiglari/mcp-server-chart.git

   cd mcp-server-chart
2. Install dependencies
npm install
3. Build the project
npm run build
4. Run the server
npm start
Usage Examples
Basic Bar Chart
{
  "type": "bar",
  "data": {
    "labels": ["January", "February", "March", "April", "May"],
    "datasets": [
      { "label": "Sales", "data": [50, 60, 70, 180, 190] },
      { "label": "Expenses", "data": [100, 200, 300, 400, 500] }
    ]
  }
}
Financial OHLC Chart
{
  "type": "ohlc",
  "data": {
    "datasets": [
      {
        "label": "MSFT",
        "data": [
          {"x": 1459468800000, "o": 18.23, "h": 19.36, "l": 18.18, "c": 19.31}
        ],
        "color": {"up": "#26a69a", "down": "#ef5350", "unchanged": "#999"}
      }
    ]
  }
}
Advanced Doughnut Chart
{
  "type": "doughnut",
  "data": {
    "labels": ["Complete", "Remaining"],
    "datasets": [{"data": [75, 25], "backgroundColor": ["#4CAF50", "#E0E0E0"]}]
  },
  "options": {
    "circumference": 3.14159,
    "rotation": 3.14159,
    "plugins": {
      "doughnutlabel": {
        "labels": [{"text": "75%", "font": {"size": 24}}]
      }
    }
  }
}
Scatter Plot
{
  "type": "scatter",
  "data": {
    "datasets": [
      {
        "label": "Dataset 1",
        "data": [
          {"x": 2, "y": 4},
          {"x": 3, "y": 3},
          {"x": 5, "y": 8}
        ]
      }
    ]
  }
}
Configuration
MCP Client Configuration
Add to your MCP client configuration:
{
  "mcpServers": {
    "chart-server": {
      "command": "node",
      "args": ["path/to/mcp-server-chart/dist/index.js"]
    }
  }
}
Claude.AI Configuration
For Claude.AI integration, add one of these endpoints:
{
  "mcpServers": {
    "chart-server": {
      "url": "https://chart.mcp.cloudcertainty.com/mcp"
    }
  }
}
Development
Project Structure
src/
├── charts/           # Chart type definitions
│   ├── bar.ts       # Bar chart schema
│   ├── line.ts      # Line chart schema
│   ├── ohlc.ts      # OHLC chart schema
│   └── ...          # Other chart types
├── utils/           # Utility functions
│   ├── index.ts     # Zod to JSON schema conversion
│   └── schema.ts    # Common schema definitions
└── index.ts         # Main MCP server
Building
npm run build      # Build TypeScript
npm run dev        # Development mode with watch
npm run lint       # Run linting
Testing
npm test           # Run test suite
npm run test:watch # Watch mode testing
Chart Type Reference
| Chart Type | Use Case | Data Format |
|------------|----------|-------------|
| bar | Categorical comparisons | {labels: string[], datasets: {data: number[]}[]} |
| line | Trends over time | {labels: string[], datasets: {data: number[]}[]} |
| pie | Part-to-whole relationships | {labels: string[], datasets: {data: number[]}[]} |
| doughnut | Enhanced pie charts | {labels: string[], datasets: {data: number[]}[]} |
| radar | Multi-variable comparison | {labels: string[], datasets: {data: number[]}[]} |
| polarArea | Cyclical data | {labels: string[], datasets: {data: number[]}[]} |
| scatter | Correlation analysis | {datasets: {data: {x: number, y: number}[]}[]} |
| bubble | Three-dimensional data | {datasets: {data: {x: number, y: number, r: number}[]}[]} |
| ohlc | Financial data | {datasets: {data: {x: number, o: number, h: number, l: number, c: number}[]}[]} |
| violin | Statistical distributions | {labels: string[], datasets: {data: number[][]}[]} |
| gauge | KPI dashboards | {datasets: {value: number, data: number[]}[]} |
| sankey | Process flows | {datasets: {data: {from: string, to: string, flow: number}[]}[]} |
API Reference
Tools Available
All chart types are available as MCP tools with the following pattern:
- Tool name matches chart type (e.g., bar, line, ohlc)
- Input schema validates chart configuration
- Returns generated chart data
Schema Validation
Every chart type includes comprehensive Zod schemas that validate:
- Chart type and structure
- Data format and types
- Styling options
- Chart-specific configurations
Contributing
1. Fork the repository
2. Create a feature branch
3. Add your chart type or improvement
4. Include tests and documentation
5. Submit a pull request
License
MIT License - see LICENSE file for details
Support
- 📚 Documentation: Check the inline schema documentation
- 🐛 Issues: Report bugs via GitHub Issues
- 💬 Discussions: Use GitHub Discussions for questions
- 🌐 Live Demo: Try the public endpoints with Claude.AI
Roadmap
- [ ] Real-time data binding
- [ ] Custom theme support
- [ ] Export formats (PNG, SVG, PDF)
- [ ] Animation and interaction options
- [ ] Dashboard layout compositions
Sign in to leave a review
Use Google, GitHub, or an email account so ratings stay tied to real people.
No reviews posted yet.





